CalculatorsMapsCountriesRankingsCompareTechnologiesLearn Energy Explorer Solar & wind farms Glossary
Interactive maps · open data

The world’s energy, mapped

Interactive maps built on the best open datasets: watch every country’s electricity change since 1985, explore 34,936 power plants and 122,938 solar and wind farms, read the solar and wind resource anywhere on Earth, and click any spot for its own energy profile.

FijiTanzaniaWestern SaharaCanadaUnited StatesKazakhstanUzbekistanPapua New GuineaIndonesiaArgentinaChileDR CongoSomaliaKenyaSudanChadHaitiDominican RepublicRussiaBahamasFalkland IslandsNorwayGreenlandFr. S. Antarctic LandsTimor-LesteSouth AfricaLesothoMexicoUruguayBrazilBoliviaPeruColombiaPanamaCosta RicaNicaraguaHondurasEl SalvadorGuatemalaBelizeVenezuelaGuyanaSurinameFranceEcuadorPuerto RicoJamaicaCubaZimbabweBotswanaNamibiaSenegalMaliMauritaniaBeninNigerNigeriaCameroonTogoGhanaCôte d'IvoireGuineaGuinea-BissauLiberiaSierra LeoneBurkina FasoCentral African RepublicRepublic of the CongoGabonEquatorial GuineaZambiaMalawiMozambiqueEswatiniAngolaBurundiIsraelLebanonMadagascarPalestineGambiaTunisiaAlgeriaJordanUnited Arab EmiratesQatarKuwaitIraqOmanVanuatuCambodiaThailandLaosMyanmarVietnamNorth KoreaSouth KoreaMongoliaIndiaBangladeshBhutanNepalPakistanAfghanistanTajikistanKyrgyzstanTurkmenistanIranSyriaArmeniaSwedenBelarusUkrainePolandAustriaHungaryMoldovaRomaniaLithuaniaLatviaEstoniaGermanyBulgariaGreeceTürkiyeAlbaniaCroatiaSwitzerlandLuxembourgBelgiumNetherlandsPortugalSpainIrelandNew CaledoniaSolomon IslandsNew ZealandAustraliaSri LankaChinaTaiwanItalyDenmarkUnited KingdomIcelandAzerbaijanGeorgiaPhilippinesMalaysiaBruneiSloveniaFinlandSlovakiaCzechiaEritreaJapanParaguayYemenSaudi ArabiaN. CyprusCyprusMoroccoEgyptLibyaEthiopiaDjiboutiSomalilandUgandaRwandaBosnia and HerzegovinaNorth MacedoniaSerbiaMontenegroKosovoTrinidad and TobagoSouth Sudan Renewables share · live 2024
Energy Time Machine

Every country’s electricity, 1985 → today

Seventeen metrics (renewables, solar, wind, nuclear, coal, gas, carbon intensity, electricity per person) on a world map you can play like a film. Click any country for its history and power mix.

Open the map →
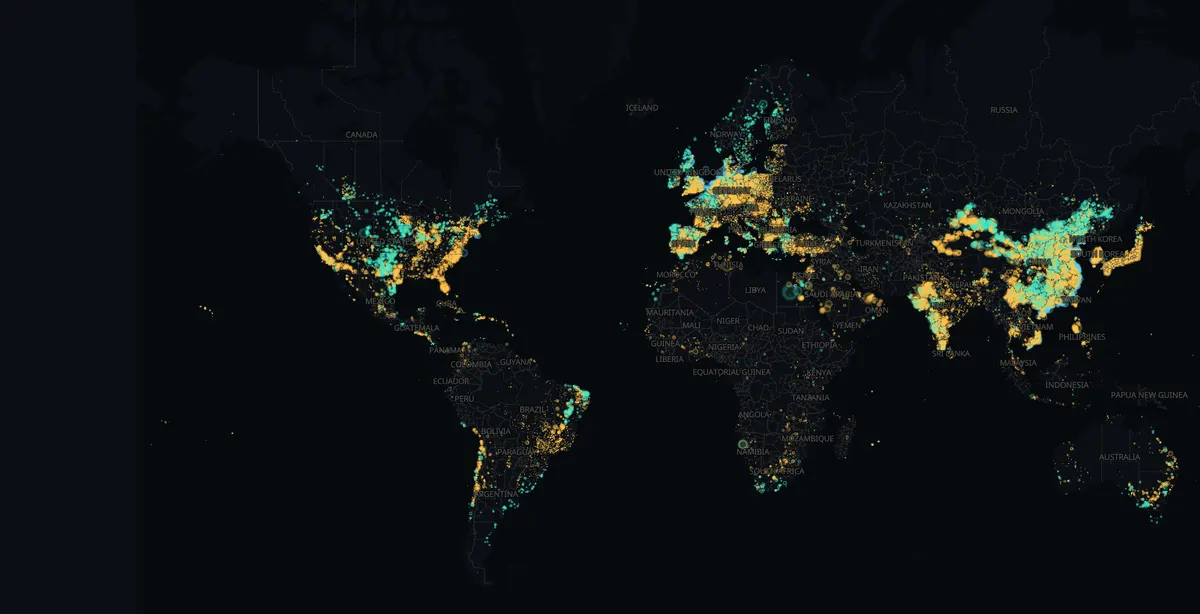
Night map of the world’s solar and wind farms122,938 farms
New · Solar & wind farms

Every solar park and wind farm on Earth

122,938 utility-scale solar and wind facilities in 222 countries: operating, under construction and planned. Glowing night map, live totals for any region, and a build-up timeline from 2000 to today.

Open the atlas →
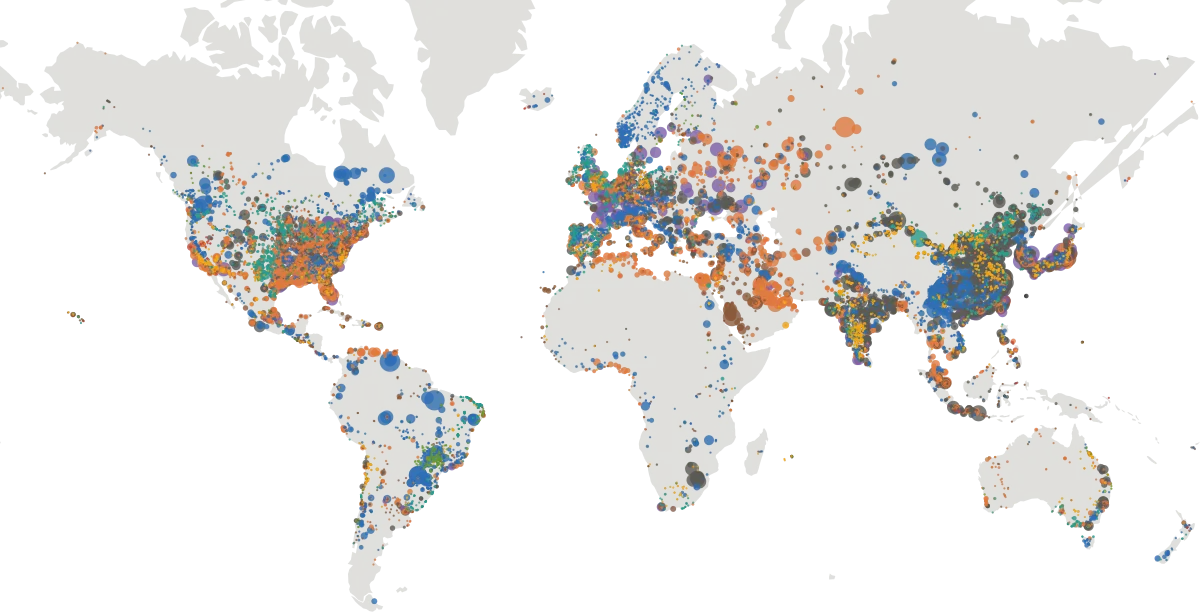
World map of power plants coloured by fuel34,936 plants
Power plants

Every major power plant on Earth

Coal, gas, nuclear, hydro, solar and wind plants sized by capacity. Filter by fuel and size, search by name, see live stats for any region.

Explore plants →
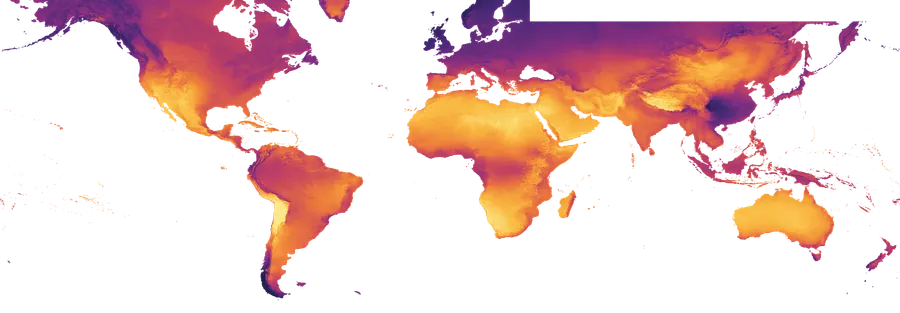
World solar PV potential map
Solar potential

How much would a solar panel make here?

PV output in kWh per kWp for every place between 60°S and 65°N, from the Global Solar Atlas. Hover for values, click to calculate.

Open solar map →
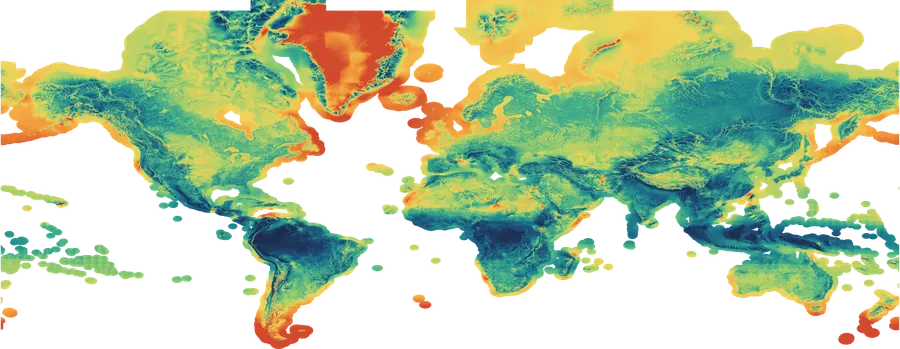
World wind speed map at 100 m
Wind potential

Where the wind blows strongest

Mean wind speed at 100 m from the Global Wind Atlas, with power density and turbine capacity factor on hover.

Open wind map →
Energy Explorer

Click anywhere on Earth

Solar yield, best tilt, wind capacity factors, climate and grid mix for any point, from NASA data, in two seconds. Share your spot.

Start exploring →

Why maps?

Energy is geographic. Whether a solar panel pays back in five years or fifteen, whether a wind turbine turns 40% of the time or 15%, and whether your electricity comes from coal or from rivers all depend on where you are. Tables of national statistics hide those patterns. On a map you see them in a second: the sun belt across the deserts, the windy rim of the Southern Ocean, the coal heartlands of Asia, the hydro-powered Andes and Scandinavia.

Each map works for a quick look and for real work. Hover or tap for exact numbers, click for details, and follow links straight into our calculators with the location already filled in. Every view is reflected in the address bar, so you can bookmark it, drop it into a report or share it with the “Share this view” button.

The datasets behind the maps

  • Our World in Data energy dataset: annual electricity generation by source, shares, carbon intensity and per-capita energy for 200+ countries, compiled from Ember, the Energy Institute and EIA (CC BY 4.0).
  • Global Energy Monitor trackers: 122,938 utility-scale solar and wind farms, operating, under construction and planned (CC BY 4.0).
  • WRI Global Power Plant Database: 34,936 grid-scale power plants with location, capacity, fuel and generation (CC BY 4.0).
  • Global Solar Atlas 2.0: long-term photovoltaic output potential, by Solargis for the World Bank and ESMAP (CC BY 4.0).
  • Global Wind Atlas 3: mean wind speed at 100 m on a 250 m grid, by DTU for the World Bank and ESMAP (CC BY 4.0).
  • NASA POWER: 30+ years of satellite and reanalysis climatology (solar irradiation, temperature, wind) for any point (public domain).

Basemaps are drawn with MapLibre and OpenFreeMap tiles using © OpenStreetMap contributors data. For how we process each source, see our methodology.

Frequently asked questions

Are these maps free to use and share?
Yes. All maps are free, need no account and work on phones. Every map keeps its state in the link (metric, year, position, filters or selected point), so you can share exactly what you see. The underlying data is open (CC BY 4.0 or public domain); if you reuse screenshots, please credit GreenEnergy.net and the original data source named on each map.
Where does the data come from?
Country energy statistics: Our World in Data (compiling Ember, the Energy Institute Statistical Review and EIA). Solar and wind farms: Global Energy Monitor. Power plants: the World Resources Institute Global Power Plant Database. Solar potential: the Global Solar Atlas (World Bank, ESMAP, Solargis). Wind: the Global Wind Atlas (DTU, World Bank, ESMAP). Point climate data in the Explorer: NASA POWER. Each map page lists its sources in full.
Which map should I use to check my own house?
Use the Energy Explorer or the solar potential map: search your town, click your location and follow the link into the solar panel or wind turbine calculator, which opens pre-filled with your coordinates.
How up to date are the maps?
The country map covers 1985 to 2024 (the most recent year includes fewer countries). The solar and wind atlases are long-term averages and change little from year to year. The power plant database is a snapshot of around 2020 and misses recent additions; see the notes on that page.
Do the maps work on mobile?
Yes. On phones the map takes the top of the screen, controls move underneath, and details open as a bottom sheet you can swipe away. Pinch to zoom; tap instead of hover.